How to Predict Store Sales in Python
If you’re in the retail business, predicting store sales is crucial for making informed decisions about inventory, staffing, and budgeting. In this post, we’ll show you how to use a Python script to predict store sales for the next month based on historical data.
If you want to predict store sales in python, there are a variety of methods available(https://pypi.org/project/prophet/). However, many of them require large amounts of data, making it difficult for businesses with limited data to implement them. This is where the average increments method comes in handy. Here are some advantages ot the increments menthod:
- The average increments method is a useful method for predicting sales with just a small amount of data.
- This method calculates average monthly increments across all stores to predict the next month’s sales. So, you can apply this method to new stores and comparable stores (stores with more than one year of history) as well.
- It is an excellent option for small businesses or new ventures that may not have years of data available.
- The method is relatively easy to implement, making it accessible to those without a background in data analysis.
Here’s the formula in mathematical notation:
Next month’s sales = Current month’s sales * (1 + Average monthly sales increments across all stores for the corresponding month)
The script uses pandas, matplotlib and numpy libraries, so make sure to install them before proceeding.
# Import necessary libraries
import pandas as pd
import matplotlib.pyplot as plt
import numpy as np
from collections import OrderedDict

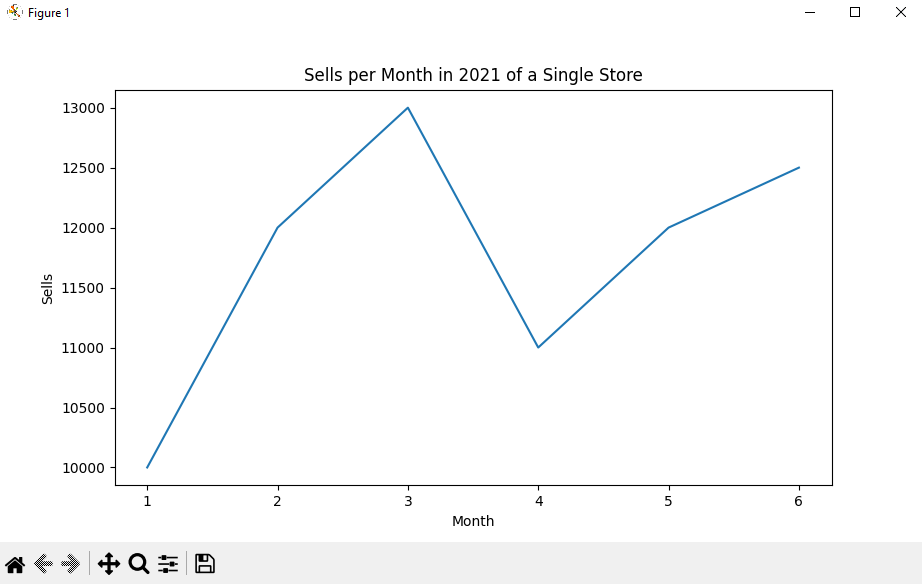
First, let's create a dataframe with historical sales data for a single store. We manually set the sells values for each month, but in real-world scenarios, this data would come from point-of-sale systems or other sources.

# Manually set the sells values
sells = [10000, 12000, 13000, 11000, 12000, 12500]

# Create a dictionary with the data
data = {
'month': [1, 2, 3, 4, 5, 6],
'year': [2021, 2021, 2021, 2021, 2021, 2021],
'sells': sells
}

# Create the dataframe
df = pd.DataFrame(data)

# Print the dataframe
print(df)
After creating the dataframe, we plot the monthly sales to visualize the trend. This will help us see if there are any seasonal patterns or trends that we need to account for in our predictions.
# Plot the dataframe
plt.plot(df['month'], df['sells'])

# Add labels and title
plt.xlabel('Month')
plt.ylabel('Sells')
plt.title('Sells per Month in 2021 of a Single Store')

# Show the plot
plt.show()
Next, we define a dictionary with average monthly increments across all stores. This data would come from historical sales data for all stores in your business.
# Average Increments
od = OrderedDict(
[(1, 0), (2, 0), (3, 0), (4, 0), (5, 0), (6, 0), (7, 0), (8, 0), (9, 0), (10, 0), (11, 0), (12, 0)])
# Average increment across all the stores from December to January
od[1] = -0.29
# Average increment across all the stores from January to February
od[2] = -0.03
# Average increment across all the stores from February to March
od[3] = 0.09
# Average increment across all the stores from March to April
od[4] = -0.01
# Average increment across all the stores from April to May
od[5] = 0.02
# Average increment across all the stores from May to June
od[6] = 0.16
# Average increment across all the stores from June to July
od[7] = 0.06
# Average increment across all the stores from July to August
od[8] = -0.04
# Average increment across all the stores from August to September
od[9] = 0.08
# Average increment across all the stores from September to October
od[10] = 0.17
# Average increment across all the stores from October to November
od[11] = 0.02
# Average increment across all the stores from November to December
od[12] = 0.45
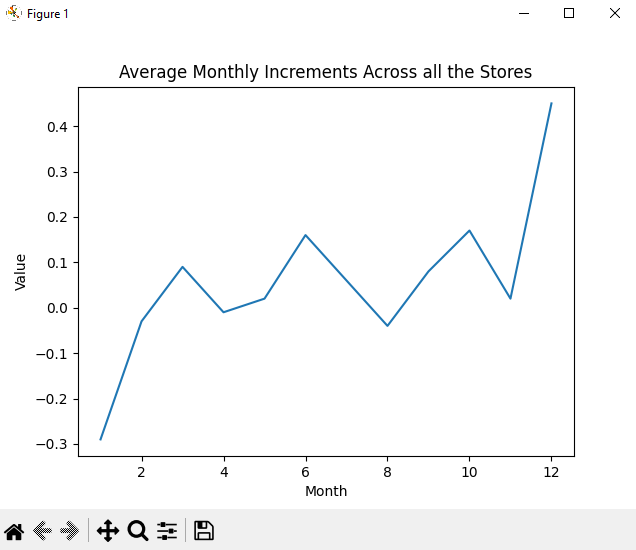
Let’s visualize those increments:
# Create a list of keys and values
keys = list(od.keys())
values = list(od.values())

# Plot the data
plt.plot(keys, values)

# Add labels and title
plt.xlabel('Month')
plt.ylabel('Value')
plt.title('Average Monthly Increments Across all the Stores')

# Show the plot
plt.show()
We can observe the overall trend of average monthly increments across all the stores. For instance, there is a decrease in sales from December to January and an increase from November to December, which is expected as it aligns with the typical behavior of sales for stores during these months. By analyzing the historical data and trends, we can make use of this information to predict the next month’s sales.
Finally, we use the predict_next_month function to predict the sales for the next month based on the last complete monthly sales available in the dataset and the average monthly increments. The function computes the month to predict, calculates the prediction, and returns it as a result.
# Predict next month
prediction = predict_next_month(od, df)
print('Prediction of the next month is:' + str(prediction))
Here is the function called predict_next_month:
def predict_next_month(avg_monthly_increments, sells_df):
# Get last month available in the dataset
df_month_list = sells_df['month'].values.tolist()
month_to_predict = df_month_list[len(df_month_list) - 1]

# Compute the month to predict which is the following month
if int(month_to_predict) == 12:
month_to_predict = 1
else:
month_to_predict = month_to_predict + 1

# Get the last complete monthly sells available in the dataset
df_sells_list = sells_df['sells'].values.tolist()
last_month_sells = df_sells_list[len(df_sells_list) - 1]

# Compute prediction
result = last_month_sells * (1 + avg_monthly_increments[month_to_predict])

return result
This is the predicted result is 13250 for the next month. Here is the console output:
You can use this method as a starting point for more advanced algorithms.
To predict sales for a different store or time period, you can modify the sells values and use the average monthly increments of all the stores.
If you need the code in github, please tell us at the following page: https://matchkraft.sleekplan.app/
